The decade-long economic expansion did not end with a whimper. The coronavirus brought it to a screeching halt.
U.S. gross domestic product (GDP) fell 5% in the first quarter, and a steeper decline is likely in the second. Consumer spending, which accounts for about two-thirds of the U.S. economy, slid 13.6% in April, the steepest decline on record.
More bad news lies ahead in the short term, starting with the tragic human cost. Historic unemployment will likely have a lasting impact on the economy, and many businesses are failing. The path to economic recovery will depend on the course of the virus and public health response, and stock markets may bounce around for an extended period until the economy finds firmer footing.

Market recoveries have been longer and stronger than downturns
There will certainly be ups and downs. Because the slowdown was the result of government policy — not economic imbalances or rising rates ― we can see what recovery can look like when policies are relaxed.
Of course, when you’re in the middle of a downturn, it feels like it’s never going to end. But it’s important to remember that market recoveries have been longer and stronger than downturns. Over the past 70 years the average bear market has lasted 14 months and resulted in an average loss of 33%. By contrast, as measured by Standard & Poor’s 500 Composite Index, the average bull market has run for 72 months — or more than five times longer — and the average gain has been 279%.
Moreover, returns have often been strongest right after the market bottoms. After the carnage of 2008, for example, U.S. stocks finished 2009 with a 23% gain. Missing a bounce back can cost you a lot, which is why it’s important to consider staying invested through even the most difficult periods.
Long-term investors may take comfort in knowing that tough companies have often been born in tough times. Consider these examples: McDonald’s emerged in 1948 following a downturn caused by the U.S. government’s demobilization from a wartime economy. Walmart came along 14 years later, around the time of the “Flash Crash of 1962” — a period when the Standard & Poor’s 500 Composite Index declined more than 22%. Microsoft and Starbucks were founded during the stagflation era of the 1970s, a decade marked by two recessions and one of the worst bear markets in U.S. history.
Companies that can adapt and grow in tough times often present attractive long-term investment opportunities. Bottom-up, fundamental research is the key to separating these resilient companies from those likely to be left behind.

The post-COVID market presents opportunity for selective investors
While the pain of the current downturn has been widespread, its impact has not been universal. With stores shuttered and consumers mostly sheltered at home, U.S. retail sales slid an unprecedented 16.4% in April, according to the U.S. Commerce Department. But that’s not the whole story.
A look beneath the surface of the U.S. stock market shows there has been a stark divide between winners and losers in this era of limited mobility. Not surprisingly, online retailers and grocers have enjoyed strong sales growth as consumers eat in and do their shopping in front of a screen. Providers of broadband, health care, home improvement materials and educational services have also benefited from healthy demand. Conversely, restaurants, travel and leisure companies, and aerospace companies have seen sales evaporate.
We are witnessing a number of exciting themes emerge during this crisis. Within health care, for example, we are seeing telemedicine come to the forefront, as elements of the national health system go online, improving efficiency for many patients. To be sure, not all companies will equally tap into rising opportunity, so selective investing will be critical going forward.

Digitization of daily life is here to stay
Some of the recent demand activity reflects an amplification of already established trends. Cloud demand, for example, was sky-high before the COVID-19 outbreak. But the events of 2020 have kicked that theme into overdrive. In the stay-at-home era, e-commerce, mobile payments and video streaming services have soared in popularity, occasionally pushing the limits of technology. While the levels of online activity are likely to moderate, the pandemic could be a catalyst for even stronger e-commerce growth in the years ahead.
The response to the COVID-19 crisis — keeping everyone at home — has accelerated this powerful trend of digitizing the world.
Services that were already useful have in some cases become almost essential. Many people felt compelled to try grocery delivery for the first time, for example, and subscriptions to Netflix skyrocketed.
There’s also room to advance. While e-commerce has grown in popularity, it still represents only about 11% of U.S. retail sales last year, and mobile payments stood at similarly low levels. Given where we are now in the consumer-technology space, the growth potential is truly exciting.

Don’t forget: A presidential election is looming
In an odd twist of political and economic fate, the event that everyone thought was going to be the biggest story of the year has been relegated to an afterthought. And maybe that’s the best way for investors to think about it.
That’s because, historically speaking, presidential elections have essentially made no difference when it comes to long-term investment returns. The U.S. stock market has powered through every election since 1933, reaching new highs over time regardless of whether a Republican or a Democrat won the White House.
What has mattered most is staying invested. Getting out of the market during election season has rarely paid off. It’s time, not timing, that makes the difference.
By design, elections have winners and losers, but the real winners have been investors who avoided the temptation to time the market and stayed in it for the long haul.
Chinese authorities deal with a rapidly spreading coronavirus, investors are raising questions about the potential impact on global economic growth and the financial markets. While much is still unknown about the extent of the outbreak — and, crucially, how long it may last — the initial drag on China and other emerging markets is starting to come into focus.
China’s Economy and the Coronavirus Outbreak
China’s economy was already growing at the slowest rate in 30 years before reports of the outbreak first emerged in the central China city of Wuhan. Since then, the Chinese government has placed a dozen cities under quarantine, shut down businesses and schools, and restricted travel in the affected regions. More than 7,700 infections have been reported as of January 30, including a small number in the U.S., Europe and other parts of Asia.
Given the quarantine lockdowns, it’s highly likely that the numbers of infected people in mainland China are significantly underestimated especially in rural areas where medical facilities are limited.
Depending on how long it takes to contain the coronavirus, there should be sizable declines in consumer spending and manufacturing activity at least through the end of February.
A Global Slowdown from the Coronavirus Outbreak
Outside China, the biggest economic impact is expected to be in Thailand, which relies heavily on Chinese tourism. Among industries, travel and tourism throughout Asia will likely take a significant hit, along with sales of luxury goods. In addition, many events associated with China’s lunar new year have been canceled. Energy stocks also have fallen sharply as investors expect oil prices to decline further amid lower demand from China.
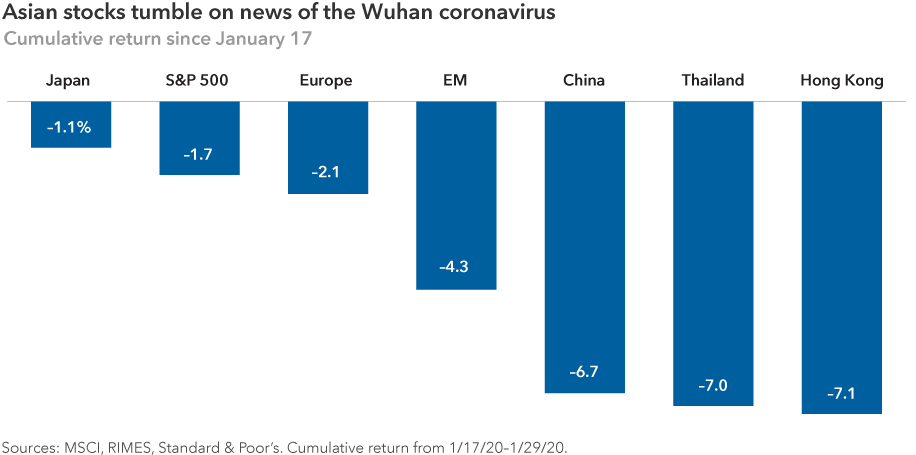
Since news reports about the virus accelerated around January 17, emerging markets stocks have declined by about 4%, as measured by the MSCI Emerging Markets IMI. Chinese stocks are down more than 6% and Thai stocks slipped 7%. By comparison, the MSCI World Index declined 1.3% during the period through January 29.
If the economy and markets continue to deteriorate, Chinese authorities are likely to launch new stimulus measures, including potential tax cuts and interest rate cuts.
How will the US economy be affected by the Coronavirus Outbreak?
U.S. stocks, meanwhile, have lost about 2% on worries that the outbreak could have a spillover effect on the U.S. economy, including American companies that do business in China. Starbucks has closed about half of its 4,300 stores in China. Many U.S.-based airlines are also canceling flights to the country. And there are growing concerns about supply-chain disruptions for companies such as Apple that have significant manufacturing operations there.
Coupled with Boeing’s recent troubles returning the 737 Max jet to service, the outlook for the U.S. economy now looks more uncertain than it did just a few weeks ago, says Capital Group U.S. economist Jared Franz. Fourth-quarter U.S. GDP growth came in at 2.1% on an annualized basis, according to Commerce Department figures released on Thursday.
If 737 Max production remains grounded through July, then it’s estimated the impact on first-half GDP growth will be roughly –0.5 percentage points. The economic impact of the coronavirus on the U.S. is more difficult to calibrate, but expected to be modest and mostly felt through trade disruption and financial linkages.
Assuming the outbreak is contained soon, it’s likely global economic growth will experience a V-shaped recovery characterized by slower growth in the first half and a significant acceleration in the second half of the year. The U.S. economy will probably follow the same course.
U.S. economic fundamentals remain sound, labor markets are resilient and the Federal Reserve stands ready to take action as needed. The coronavirus looks to be a modest but temporary restraint on U.S. economic activity via secondary channels of impact, but should not derail growth expectations of roughly 2% in 2020.
Coronavirus Outbreak Compared to SARS
That’s similar to the pattern shown after the SARS outbreak that hit China in 2002 and 2003. Key indicators bounced back quickly after the virus was contained. Many investors are looking at the SARS event as a template for what might happen in the weeks and months ahead — although it’s important to note that there were many other factors during that time period, including the aftermath of the 9/11 attacks and the U.S. invasion of Iraq in 2003.
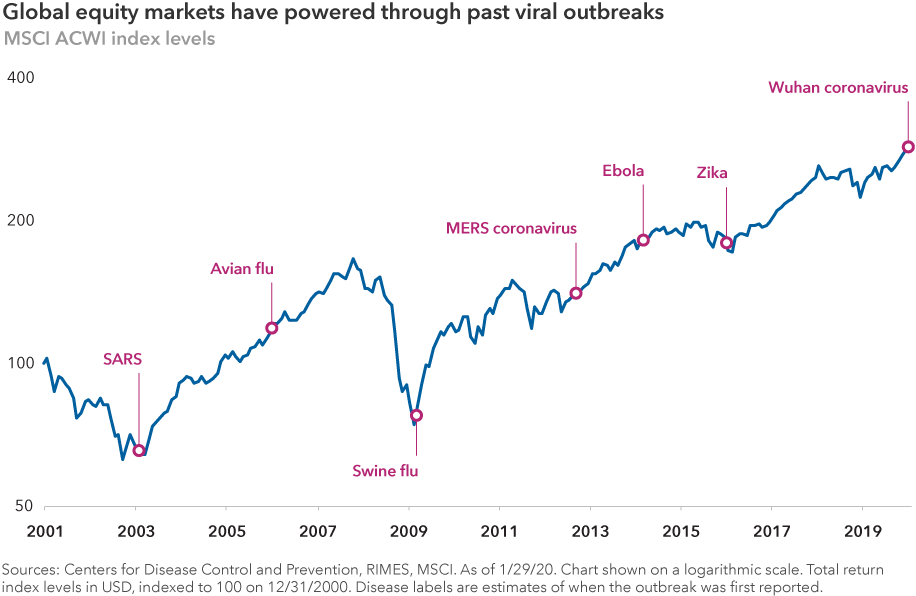
In addition, the structure of the global economy was significantly different. The Chinese economy was largely investment-driven at that time. Consumer spending is a much larger percentage of total economic output today. Travel and tourism activity also was much lower than it is now, with Chinese tourism skyrocketing over the past decade.
Investment Implications
That’s similar to the pattern shown after the SARS outbreak that hit China in 2002 and 2003. Key indicators bounced back quickly after the virus was contained. Many investors are looking at the SARS event as a template for what might happen in the weeks and months ahead — although it’s important to note that there were many other factors during that time period, including the aftermath of the 9/11 attacks and the U.S. invasion of Iraq in 2003.
In addition, the structure of the global economy was significantly different. The Chinese economy was largely investment-driven at that time. Consumer spending is a much larger percentage of total economic output today. Travel and tourism activity also was much lower than it is now, with Chinese tourism skyrocketing over the past decade.
As with any large-scale crisis, long-term investors should look for select opportunities that may be generated by a near-term loss of confidence. This is when long-term thinking, on-the-ground research and a focus on value can make a meaningful difference.
Investment management for volatile times
At Platt Wealth Management we build your investment portfolio to support the future you envision for yourself. Reduce risk and see returns you can be comfortable with in volatile market conditions. Give us a call today to set up a complimentary review at 619-255-9554.