Of all the fears investors have faced over the past 30 years, high inflation wasn’t among them. In 2021, that’s changed.
Today, the biggest questions for investors revolve around inflation: How high will it go and how long will it last? Is it “transitory” as the Federal Reserve claims? Or is elevated inflation the new normal amid labor shortages, supply chain bottlenecks and a severe energy crunch?
The uncertain path of the pandemic makes near-term conditions difficult to predict but, over the long term, the picture comes into better focus.
Economic growth should slow due to high debt levels and fading stimulus, resulting in a return to GDP gains of 1.5% to 2.5% a year. Consequently, interest rates should stay relatively low as well.
Two types of inflation

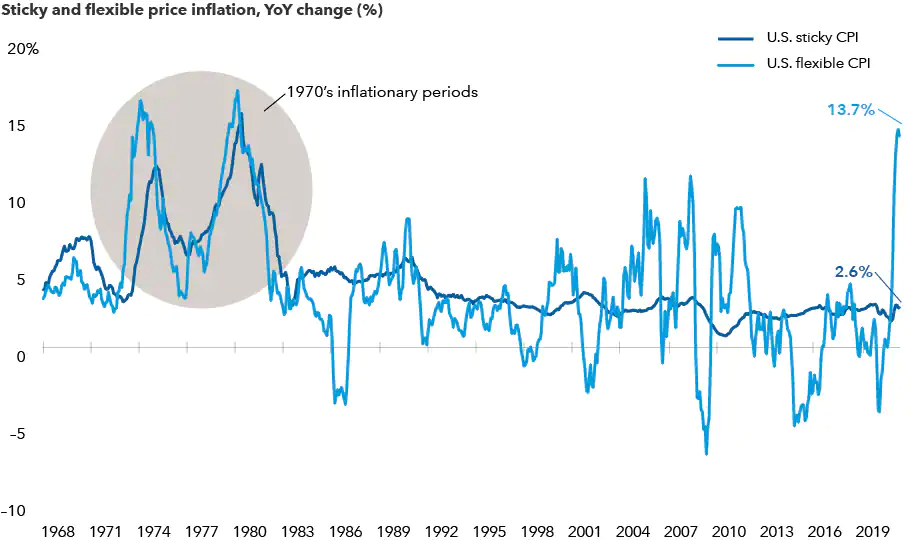
Sources: Federal Reserve Bank of Atlanta; Refinitive Datastream. Sticky and flexible prices reflect the Atlanta Federal Reserve sticky and flexible consumer price indexes (CPI). If price changes for a particular CPI component occur less than every 4.3 months, that component is a “sticky-price” good. Goods that change prices more frequently are “flexible-price” goods. As of August 2021.
Sticky or Flexible Inflation?
A source of uncertainty today is that there are two different types of inflation: sticky and flexible. Sticky inflation, currently around 2.6% annualized, tends to exhibit longer staying power. Sticky categories include rent, owners’ equivalent rent, insurance costs and medical expenses.
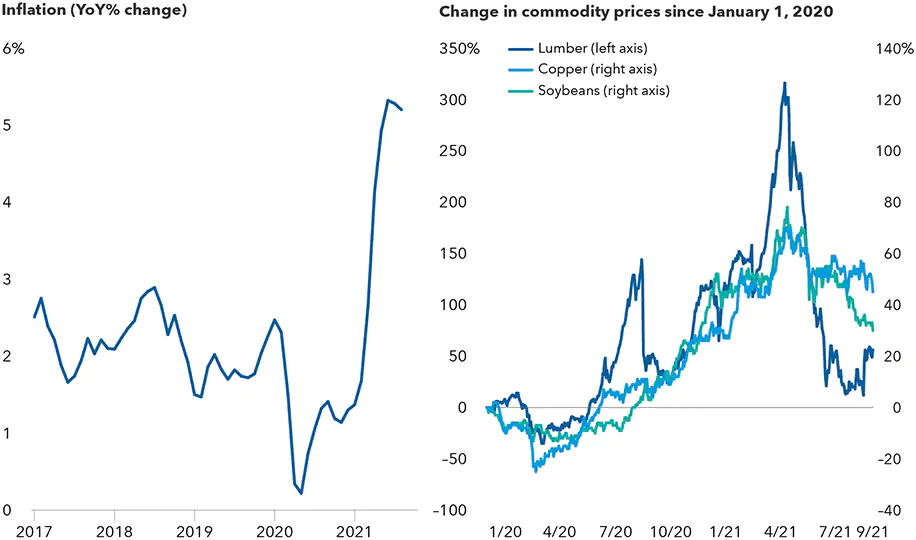
Flexible inflation has climbed this year to nearly 14% — the highest since the 1970s. However, this level of inflation likely won’t last. The flexible category contains products such as food, energy and cars, where prices can move a lot higher or lower over time. For instance, that’s already happened with lumber, copper and soybeans. Prices for those products skyrocketed this spring and have since come down.
Price flare-ups in key commodities are starting to level out

Sources: Capital Group, Bureau of Labor Statistics, Refinitiv Datastream. Inflation is measured by the Consumer Price Index for All Urban Consumers (CPI-U) as of 8/31/21. Commodity prices are as of 9/30/21.
Watch out for sticky inflation
As anyone who has tried to buy a used car knows, flexible inflation categories have spiked due to pandemic-related shortages, a lack of available labor and supply chain disruptions. A quick resolution to these challenges is unlikely, but more normal conditions should return by mid to late 2022.
What that means is, the upside risk is in the sticky components. Many of the flexible price categories moved higher for transitory reasons, but inflation in those areas may come back down to zero or even go negative. The sticky components will drive inflation in 2022 so that’s what investors need to keep an eye on.
The Fed will not be in a hurry to raise rates and potentially derail the COVID recovery if inflation remains in check. In short, flexible inflation is transitory, but sticky inflation could be troublesome.
Overall inflation as measured by the U.S. Consumer Price Index should gradually decline in the months ahead, eventually falling into a range of 2.50% to 2.75% by the end of 2022.
If that prediction holds, there’s a good chance the Federal Reserve will not raise interest rates in 2022. The Fed might officially announce in November that it will begin reducing its bond-buying stimulus program. That process will take several quarters. And the Fed’s first rate hike will come in 2023, which is later than market expectations.
What if this benign inflation outlook is wrong and consumer prices move sharply higher?
That is by no means our base case, but it is a big enough risk that it should factor into portfolio construction.
What inflation means for investments
For stocks, there are a few rules of thumb to consider. Historically, higher prices have boosted commodities, as well as sectors that benefit from higher interest rates (such as banks) and companies with pricing power in must-have categories like semiconductors and popular consumer brands.
Before making portfolio adjustments, it’s important to remember that sustained periods of elevated inflation are rare in U.S. history. People of a certain age will remember the ultra-high inflation of the 1970s and early 1980s. But in hindsight, it’s clear that was a unique period. In fact, deflationary pressures have often been more difficult to tame, as students of the Great Depression will attest.
Over the past 100 years, U.S. inflation has stayed below 5% the vast majority of the time. More recently, in the aftermath of the 2007–2009 global financial crisis, inflation has struggled to hit 2% on a sustained basis. And that’s despite unprecedented stimulus measures engineered by the Fed in an attempt to reach the central bank’s 2% goal.
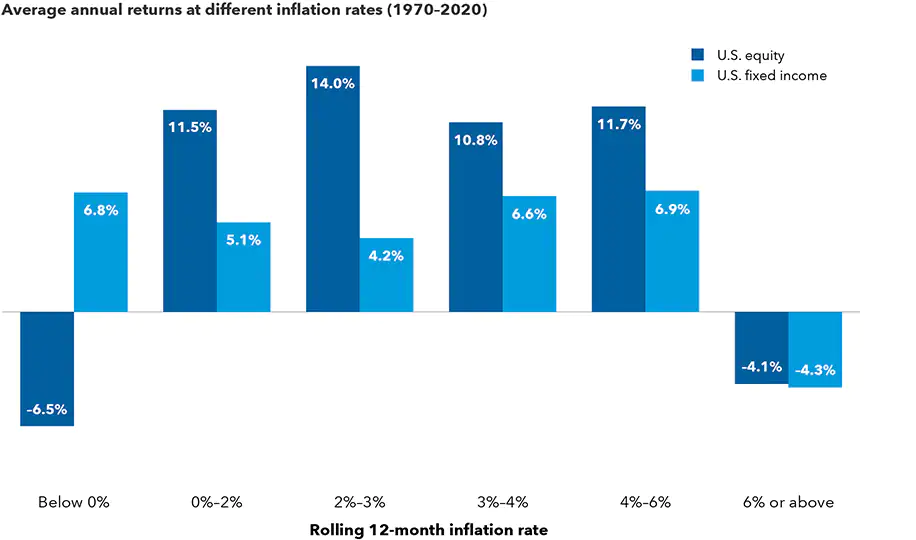
Another important point: It’s mostly at the extremes — when inflation is 6% or above — that financial assets tend to struggle. Stocks have also come under pressure when inflation goes negative, as one would expect.
For investors, some inflation can be a good thing. Even during times of higher inflation, stocks and bonds have generally provided solid returns as shown in the chart below.
Stocks and bonds have done well in various inflation environments

Sources: Capital Group, Bloomberg Index Services Ltd., Morningstar, Standard & Poor’s. All returns are inflation-adjusted real returns. U.S. equity returns represented by the Standard & Poor’s 500 Composite Index. U.S. fixed income represented by Ibbotson Associates SBBI U.S. Intermediate-Term Government Bond Index from 1/1/1970–12/12/1975 and Bloomberg U.S. Aggregate Bond Index from 1/1/1976–12/31/2020. Inflation rates are defined by the rolling 12-month returns of the Ibbotson Associates SBBI U.S. Inflation Index.
Are you on track for retirement?
Making sure you will be ready for retirement can be overwhelming. Funding your retirement accounts over the years is a critical part of your journey to the retirement of your dreams. An experienced Financial Advisor can help you navigate the complexities of investment management. Talk to a Financial Advisor>
Dream. Plan. Do.
Platt Wealth Management offers financial plans to answer your important financial questions. Where are you? Where do you want to be? How can you get there? Our four-step financial planning process is designed to be a road map to get you where you want to go while providing flexibility to adapt to changes along the route. We offer stand alone plans or full wealth management plans that include our investment management services. Give us a call today to set up a complimentary review. 619-255-9554.

