Newsletter

2021 1st Quarter Review

2021 1st Quarter Review

Q1 CLOSES HIGH

The S&P 500 was up 6.17% 1st quarter of 2021. The Wilshire 5000, an index that tracks all actively traded US stocks, was up 2.54%.

The Russell 2000 Value Index returned 21.17% outperforming the Russell 2000 Growth Index at 4.88%.

1st quarter of 2021, energy and financials outperformed both technology and communications services, a reversal from 2020.

The 10-year Treasury yield began the year with a rate of 0.93% and ended the quarter at 1.74%. The 30-year Treasury yield began 2021 with a rate of 1.66% and ended the quarter at 2.41%.

INTEREST RATES

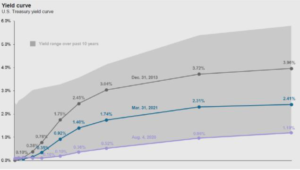
In the bond markets, rates on longer-term securities jumped from historically low rates to simply low rates. Last year at the end of the first quarter the 10-year Treasury yield was 0.70% and the 30-year rate was 1.35%. They finished the year higher at 0.93% for the 10-year and 1.66% for the 30-year. This past quarter they moved considerably higher with the 10-year at 1.74% and the 30-year Treasury at 2.41%. These are sizable changes from when the economy was suffering from a rapid slowdown in business activity.

Concerns from investors through the quarter were not due to a 2.41% yield on the 30-year Treasury. Instead, the problem stems from the speed at which the treasury yields have increased. Increasing bond yields tend to have a negative effect on growth stocks, while value tends to outperform in these environments. Rising rates lead to lower prices on fixed-income securities. This will be a concern going forward. The Federal Reserve continues to support “keeping rates lower for longer” during the economic recovery.
Graph by JP Morgan


VALUE VERSUS GROWTH

Value versus growth investing has been and always will be a topic of debate. However, over the last decade, growth has outperformed value with large-cap growth, mid-cap growth, and small-cap growth outperforming their value counterparts.
While the performance of growth stocks has been undeniable, there comes the point where the pendulum begins to swing in the other direction. Through the 1st quarter of 2021, we saw a rise in interest rates and a cooling off of big-name growth stocks. For the quarter, large-cap value, mid-cap value, and small-cap value significantly outperformed their growth counterparts—a big shift from the past 10-years. As the economy heals, we could see sustainable momentum in the value investing strategy as investors seek out companies positioned to capitalize on an economic re-opening.

UNEMPLOYMENT

The unemployment numbers immediately following the beginning of the Coronavirus Pandemic were staggering. In April of 2020, unemployment levels hit 14.8%, the highest rate since the great depression. As of the end of the 1st quarter of 2021, the unemployment rate was 6.2%, which is a significant improvement and positive sign going forward. For context, the 50-year average unemployment rate is roughly 6.3%. If a compromise can be reached on an infrastructure plan, unemployment numbers will further improve over time.

Our Contact Information

3838 Camino del Rio North
Suite 365
San Diego, CA 92108
619.255.9554

info@plattwm.com

https://plattwealthmanagement.com/

COVID-19 AND VACCINATIONS

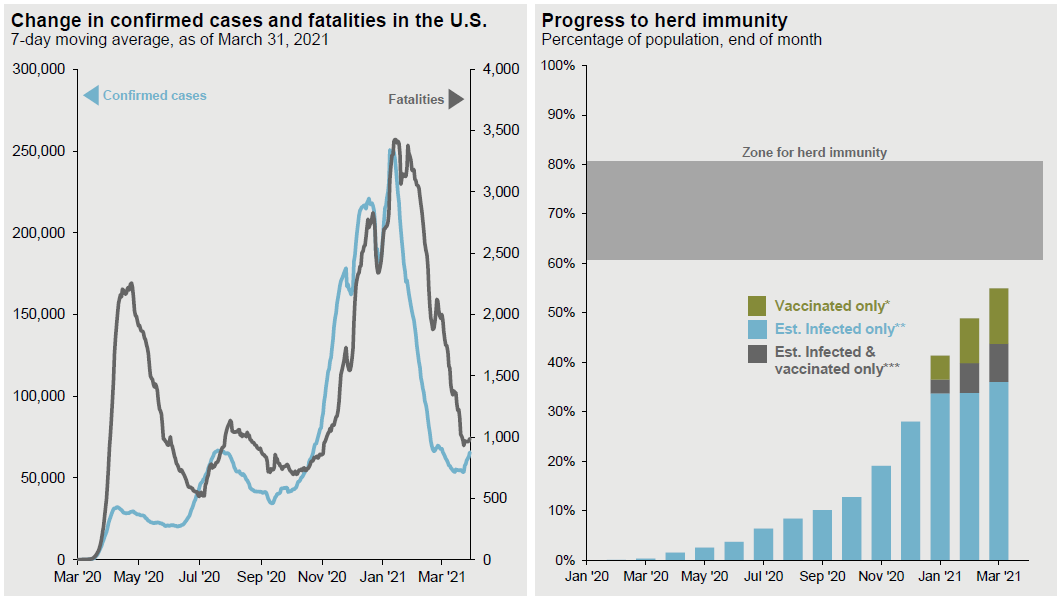
Cases and fatalities from the Coronavirus have decreased rapidly over the past few months. This has been due to an effective roll-out of vaccinations and advancements in therapeutics. For example, at the beginning of the year, the 7-day average for new cases in the United States was roughly 250,000. But by March 31st, 2021, the 7-day average was about 64,400 new cases.

On the vaccine front, per the CDC, approximately 110,000,000 Americans have received at least one dose of the vaccine, making up roughly 33% of the population (as of April 7th, 2021). While 64,400,000 million Americans are fully vaccinated, approximately 19% of the population (as of April 7th, 2021). While there is still much work to be done, we may be beginning to see the light at the end of the tunnel.
Graph JP Morgan

YOUR PORTFOLIO AND YOUR GOALS

We look forward to meeting with you and taking the time to make sure you’re on track to achieve your goals. It’s always a good idea to revisit your asset allocation to make sure you are invested in a portfolio that is right for you. The proper asset allocation enables you to stay the course when challenging market environments occur. We also want to know if anything has changed recently that could impact your financial future. Platt Wealth Management is here to serve as your financial resource. Please reach out to us with any questions or concerns.

Warmest regards,
Platt Wealth Management

2020 4th Quarter Review

2020 4th Quarter Review

Q4 FINISHES AHEAD

The S&P 500 and Nasdaq finished the quarter up 12.15% and 15.63%, respectively. For the year, the S&P gained 18.4%. Nasdaq was up 44.92%

Growth outpaced Value for the year with gains of 38.5% and 2.8%, respectively.

Since the market low in March 2020, all major domestic stock indices are up over 60%.

US Treasury yields remain low, with the 10-year rate at .93% and the 30-year rate at 1.65%.

The unemployment rate as of November 2020 was 6.7% compared to 14.7% in April of 2020.

ECONOMIC RECOVERY

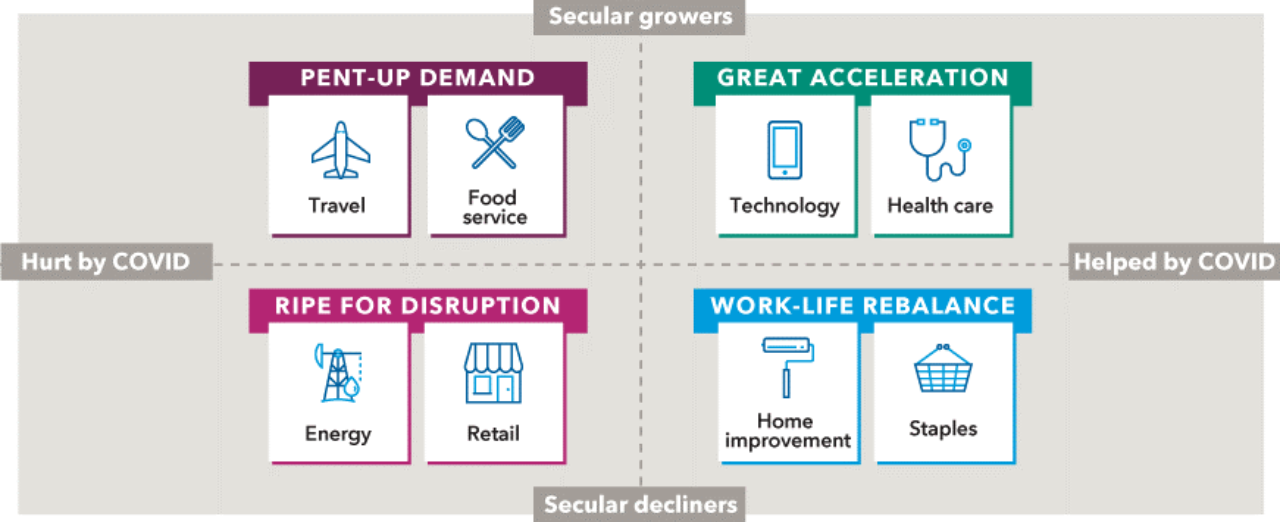
Six months ago we posed the question, “What shape will the economic recovery take? Will it be an initial such as U, V, or W? Or a symbol such as the Nike swoosh?” It is now apparent that we missed a letter, as the recovery has taken on the shape of a K. Sectors of the economy have moved quite differently from one another. Online retail was up 69% in 2020, and information technology was up 44%, with home improvement in 3rd place, up 28%. The losers were energy, airlines, retail REITS and hotels, resorts & cruise lines, down 34%, 31%, 28%, and 26%, respectively.

Cloud computing, e-commerce, video streaming, digital payment processors and home improvement stores benefited from the COVID pandemic. Restaurants, hotels, airlines, retailers and small businesses have been decimated. Yet, there is pent-up demand for many of these industries.

THE FLIGHT TO NOWHERE

On October 10, 2020, a Qantas Airlines flight took off from Sydney, Australia for a seven-hour flight to Sydney, Australia. That’s not a misprint. The non-stop flight took off from Sydney and arrived seven hours later in Sydney. What is even more remarkable is that the flight sold out in 10 minutes. People are yearning to travel once again and will do so as it becomes safer. The recovery will not be as fast as airlines, hotels, cruise ships, restaurants, or theaters would like, but it will happen.

UNEMPLOYMENT

Unemployment was below 4% at the start of the year. By April, it had soared to nearly 15%, its highest level since the depression. At the end of the year, the unemployment rate fell to 6.7%, and the number of unemployed was at 10.7 million. While both measures are much lower than their April highs, they are nearly twice their pre-pandemic levels in February of 3.5% and 5.7 million.

Our Contact Information

3838 Camino del Rio North
Suite 365
San Diego, CA 92108
619.255.9554

info@plattwm.com

https://plattwealthmanagement.com/

THE DOLLAR

The dollar fell in 2020 to multi-year lows due to historic low-interest rates, increasing government debt, and a bleak economic outlook. A declining dollar makes international markets and U.S. companies with a strong global presence more attractive. A weaker dollar means increased earnings to U.S. multi-national firms when the global economy rebounds.

MARKETS

The bull market that made its debut in March of 2009 ended in March of 2020. The S&P 500 index recorded its quickest fall from grace with a decline of 34% in one month. A gain of 68% promptly followed by the end of the year, resulting in a return of 18.4% for the index in 2020. As measured by the MSCI All Country World ex-U.S. index, international equities performed slightly worse with a decline of 39% and a rebound of 63%, producing 2020 returns of just over 3%.

2021 OUTLOOK

GDP GROWTH

The International Money Fund (IMF) estimates global GDP will rise by 5.2% in 2021. Emerging markets GDP growth is projected at 6%, with Eurozone at 5.2%, and the United States at 3.1%. These projections bode well for diversified portfolios with international exposure. Vanguard has similar projections for the Eurozone and emerging markets, although slightly greater estimates of 5% for the U.S. They anticipate, however, superior returns from international equities because of their higher dividend yield and lower valuations.

COVID AND VACCINES

Growth estimates are based on the successful rollout of vaccines. Unfortunately, we already see signs that this will take longer than hoped for. It appears infection immunity will be more likely in Q3 or Q4 of 2021.

2020 reminded us that, as we have always said, you cannot time the market. At the end of Q1 most major Wall Street firms were lowering their expectations for the markets. Goldman Sachs slashed their year-end target for the S&P 500 to 3,000 in March. They later raised it to 3,600 in August, then increased it again to 3,700 in November. It finished the year at 3,756.

We have always stressed that the right portfolio asset allocation is the one that you will not abandon during difficult times, and these were certainly difficult times. Headlines foresaw the end of the world. But as many of you have heard me say, “Statistically speaking, the end of the world does not happen that often.”

Knowing that you are still on track to achieve your goals can give you peace of mind during this tumultuous period. If you wish to discuss your portfolio or any other financial matters, please contact us for a phone call or virtual meeting.

Warmest regards,
Platt Wealth Management

2020 First Quarter Review

2020 First Quarter Review

U.S SNAPSHOT

The Fed lowered interest rates twice in March due to the coronavirus economic impact.

Unemployment claims jumped to 21.7 million in four weeks.

CARES Act passed, a $2 trillion stimulus package to help individuals and businesses.

Bonds up 3.15% in Q1.

S&P 500 down just under 20%.

MOST COMMONLY ASKED QUESTION LAST QUARTER

What should I do?

We’ve all heard the phrase, “Don’t just stand there. Do something!” John Bogle, founder of Vanguard, modified this for long-term investors to say, “Don’t do something. Just stand there!” In today’s investment environment, both expressions are true.

Most of us are at home following quarantine guidance to slow the spread of this virus and keep healthy. We have learned to use video technology to communicate for work and pleasure. This has given us the opportunity to spend more time with loved ones, catch up on binge watching or reading, or share the occasional video or humorous email. On the negative side, it has allowed us to follow news and financial outlets more often and more intently, which is probably not good for our mental health. We are bombarded with stories about the markets, which can make us think that we must do something. This leads to emotional decisions, and emotional decisions are usually wrong decisions. If you have a well-planned long-term strategy and understand the risks associated with your portfolio, now is not the time to abandon that plan. Now is the time to, “Don’t do something. Just stand there!”

What are we doing? The declines in the markets give us two opportunities which can produce better after-tax portfolio performance.

Rebalancing

We have been rebalancing portfolios to the range specified in your Investment Policy Statement (IPS). Under this disciplined approach, we buy assets that have gone down in value and sell those that have gone up in value. This will enable your portfolio to fully participate in the eventual rebound in the markets.

Tax Loss Harvesting

We have also been harvesting tax losses in taxable accounts. Tax loss harvesting is selling investments which have declined in value and “harvesting” or realizing the loss for tax purposes. The position is then replaced with a similar one so your overall asset allocation is maintained. The losses have value since they can be used to offset capital gains and up to $3,000 of ordinary income. Losses can also be carried forward to offset future capital gains.

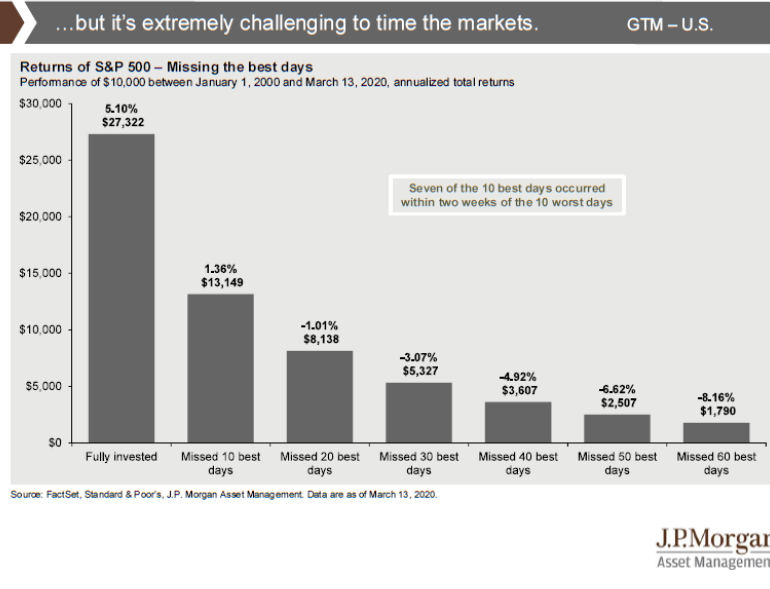
It’s Not Timing the Market That Works in the Long Run – It’s Your time in the Market

As market volatility increases, it can be tempting to ‘get out of the market until all of this is over.’ You may avoid some down days, but you also miss the up days. The chart below shows the effect of missing the best days of the market.

During the period shown, the S&P 500 index returned 5.10% annualized. If you missed the best 10 days (out of about 2,500 trading days), the annual return fell to 1.36%. If you missed the 20 best days, your returns were negative! Note that during this period, 7 of the 10 best days occurred within 2 weeks of the 10 worst days.

LOW UNEMPLOYMENT AND RISING WAGES

What impact does this have on the economy?

December unemployment hit a 50-year low of 3.5%, with employers trying to fill vacant jobs at all skill levels. Although wages have remained stagnate for the past decade, there has finally been some improvement in 2019. This is particularly true for the lowest-paid workers, mostly due to the mandate of rising minimum wages in many states and cities.
This is good news for the economy, since lower-income earners tend to have higher marginal spending, but increased wages could eventually cut into corporate profits.

Our Contact Information

3838 Camino del Rio North
Suite 365
San Diego, CA 92108
619.255.9554

info@plattwm.com

https://plattwealthmanagement.com/

We are here for you.

If you wish to discuss your portfolio or other financial matters, please contact us. We can also discuss tax and planning opportunities like Roth conversions and refinancing debt that may be attractive now. Knowing that you are still on track to reach your goals can give you peace of mind during this time.

Be smart, stay safe.

Warmest regards,

Platt Wealth Management

2019 Third Quarter Review

SCORECARD

Bonds stellar, up 2.27% in Q3 and 8.52% YTD.

S&P 500 cooled, only up 1.7% this quarter, after highs of near 20% for the first three quarters.

Domestic stocks beat international.

Large cap dominates small cap, but September saw small company stocks score better.

Value: the comeback kid? This past month large cap value and small cap value outpaced growth.

NEW ECONOMIC SIGNALS

Fed Lowers Rates

The Federal Reserve, in an expected move, lowered the Fed funds rate by 25 basis points (bps) to a range of 1.7% to 2.00%. The divergence of thought amongst Fed members was unexpected, however. One Fed member preferred a deeper cut of 50 bps, some wanted to maintain the current range, while a few while others thought a rate increase was warranted. Markets do not like uncertainty, and uncertainty certainly abounds.

Manufacturing

Manufacturing contracted in September, as the PMI® hit 47.8 percent, a decrease of 1.3 percentage points from the August reading of 49.1 percent.This is the lowest reading since June 2009, the last month of the Great Recession, when the index registered 46.3 percent.

MOST COMMONLY ASKED QUESTION LAST QUARTER

Do you think we are headed for a recession?

The US economy has slowed due to a weakening global economy and trade tensions with China. Trade talks are scheduled to resume between the US and China in October, and the sooner the better. The question remains how much longer can the American consumer keep leading the economic charge with job and wage gains.


We should be able to forestall recession a little while longer.


While the overall economy is growing, it is now doing so at a much slower pace. What is more worrisome is that the manufacturing sector is contracting and at a faster pace. This, more than an inverted yield curve, is what could be the precursor to the long-anticipated recession.

The unemployment rate fell to 3.5% and inflation stayed at about 1.5% as of the end of third quarter. With numbers like that, we should be able to forestall a recession for a little while longer.

An Inverted Yield Curve in Uncharted Territory

What is the yield curve and what does it mean when we have an inverted yield curve?

The yield curve is a graph depicting rates on US Treasury issues. Usually, it slopes upward as short-term rates are lower than long-term rates because of the additional risk associated with longer-term maturities. An inverted yield curve is when short-term rates are higher than long-term rates.

The yield curve has inverted before every recession since 1975. However, not every yield curve has been a prelude to a recession. What typically happens is the Fed raises short-term borrowing costs to cool off a heating economy that is showing signs of higher inflation.

The situation is now different. The Fed has actually twice lowered rates, yet we had brief inversions with the spreads of both the 10-year and 2-year maturities and the 10-year and 30-day maturities. This is new unchartered territory for the US – the Fed lowering short-term rates AND an inverted yield curve.

Our Contact Information

3838 Camino del Rio North
Suite 365
San Diego, CA 92108
619.255.9554

info@plattwm.com

https://plattwealthmanagement.com/

WHAT THIS MEANS FOR YOUR PORTFOLIO

We don’t know when a downturn will occur and how severe it will be. It’s a good idea to revisit your asset allocation to make sure you are invested in a portfolio that is right for you. The right asset allocation enables you to stay the course when challenging market environments occur and can give you peace of mind that your portfolio can ride out the downturn.

Reviewing your asset allocation and preparing for any short-term cash needs can help you maintain the discipline needed for long-term investment success. If you wish to discuss your allocation or any other concerns, please call us.

As always, we appreciate your trust and confidence.

Warmest regards,
Platt Wealth Management

2019 First Quarter Review

Q1 ROARS BACK

The last three months saw the market bounce up to a series of bests in the first quarter of 2019 from a series of worsts in Q4 of 2018.

The market rebound in Q1 appears to be due to positive investor sentiment on lowered interest rates and not on improvements in the underlying economic environment.

Good news for Q1:

S&P 500 Index up 13.6%.

Russell 2000 Index (small cap stocks) up 14.6%.

MSCI EAFE Index (international stocks) up 10.1%.

Barclays US Aggregate Bond Index up 2.7%.

Some of the bests:

Best quarterly performance for the S&P 500 since 2009.

Best first quarter for the S&P 500 since 1998.

Best January since 1987.

THE ECONOMY

On the positive side:

  • 196,000 new jobs added in March.
  • Year-over-year wage gains increased faster than inflation.
  • The Purchasing Managers’ Index remains above 50 indicating an expanding economy.

On the negative side:

  • U.S. corporate earnings growth expectations continued to decline.
  • The Federal Open Market Committee downgraded median GDP estimates to 2.1% for 2019 and 1.9% for 2020.
  • Europe and China reported worsening economic data.
  • The yield curve inverted, as in the past seven recessions (although not all inverted yield curves lead to a recession).

THE MOST COMMON QUESTION CLIENTS ASKED US OVER THE LAST THREE MONTHS

How long can this market keep going up? Doesn’t it have to correct?

As the longest bull market in history continues, clients wondered when the bear would come out of hibernation.


The U.S. economy, while softening, is not in a hurry to fall into a recession.


Stock prices often decrease because of lower corporate earnings, and earnings can decrease when consumer spending slows. The U.S. economy, while softening, is not in a hurry to fall into a recession. The Federal Reserve may find itself in a Goldilocks scenario; trying to find the “just right” economic balance for an environment that is not so hot as to cause inflation (and needing to raise interest rates) and not so cold as to create a recession.

WHAT THIS MEANS FOR YOUR PORTFOLIO

We don’t know when a downturn will occur and how severe it will be. It’s a good idea to revisit your asset allocation to make sure you are invested in a portfolio that is right for you. The right asset allocation enables you to stay the course when challenging market environments occur and can give you peace of mind that your portfolio can ride out the downturn. Reviewing your asset allocation and preparing for any short-term cash needs can help you maintain the discipline needed for long-term investment success. If you wish to discuss your allocation or any other concerns, please call us.

As always, we appreciate your trust and confidence.

Warmest regards,
Platt Wealth Management

Interest Rates

Short-term rates were higher than long term rates, with the 30-day Treasury higher than the 10-year issue.

The 10-year treasury was at 2.41%, down from 2.68% at the end of the year, meaning higher bond prices for fixed income investors.

Mortgage rates have fallen almost 1% since last October, resulting in rising new home sales in January and February.

OUR CONTACT INFORMATION

3838 Camino del Rio North
Suite 365
San Diego, CA 92108
619.255.9554

info@plattwm.com

www.plattwm.com

2019 Fourth Quarter Review

SCORECARD

Fed lowered rates 3 times in 2019. Inflation remains low.

Bonds: The U.S. 10-year Treasury yield fell from 2.7% to 1.8% over the course of the year, and the Barclays U.S. Aggregate has returned over 8% year-to-date.

Although at a lackluster 2.3%, the 30-year U.S. Treasury bond yield is higher than all other government debt of developed countries, so buyers might just be buying the best house in a bad neighborhood.

2019 MARKET REVIEW

The stock market reached all-time highs in 2019, with all major asset classes positive for the year. U.S. stocks continued to outperform international. The broad-based S&P 500 index was up 31.5%.

Bonds also had a very good year, up 8.72%, but most of that growth was through September.

Yes, gains in 2019 were big, but remember the almost 20% market drop at the end of 2018? The stock market finished 2019 up about 10% from the previous peak in September 2018. Much of the gain in 2019 was making up ground from the sell-off at the end of 2018.

MOST COMMONLY ASKED QUESTION LAST QUARTER

What will the market do in 2020?

The first quarter of a new year and a new decade brings questions about what the market has in store. We know the market will go up and the market will go down, sometimes on the same day. There will be short term volatility regarding the election, impeachment, trade wars, and potential military actions.


There will always be short-term bumps and noise on the road of long-term investing.


While this could cause some bumps in the road ahead, unemployment remains low, inflation remains under control, and wages are making modest increases. All of these bode well for stock prices.

2019 is a prime example of successful investing for investors that tuned out the noise of politics and warnings of the imminent end of the longest bull market in history. Ironically, a year ago everyone was talking about the possible looming recession. The concern now is that no one is talking about it. After more than a decade of economic growth, we will continue to keep our eye on underlying fundamentals and corporate earnings.

LOW UNEMPLOYMENT AND RISING WAGES

What impact does this have on the economy?

December unemployment hit a 50-year low of 3.5%, with employers trying to fill vacant jobs at all skill levels. Although wages have remained stagnate for the past decade, there has finally been some improvement in 2019. This is particularly true for the lowest-paid workers, mostly due to the mandate of rising minimum wages in many states and cities.
This is good news for the economy, since lower-income earners tend to have higher marginal spending, but increased wages could eventually cut into corporate profits.

Our Contact Information

3838 Camino del Rio North
Suite 365
San Diego, CA 92108
619.255.9554

info@plattwm.com

Home

NEW BENCHMARKS ON QUARTERLY REPORTS

Effective with the enclosed statement for Q4 2019, we have enhanced our reporting with a blended benchmark to more accurately reflect the makeup of the underlying portfolio and to measure the portfolio’s performance. The previous benchmark used the S&P 500 for stocks and the Barclays Aggregate Bond Index for bonds. The new benchmark includes proxies for additional asset classes of mid cap, small cap, and international stocks, and for short term bonds.

Stock Benchmark

60% S&P 500 Index
12% Russell Mid Cap Index
10% Russell 2000 Small Cap Index
18% MSCI EAFE (Europe, Australia, Far East) International Index

Bond Benchmark

70% Barclays Aggregate Bond Index

30% Barclays U.S. Government/Credit 1-3 Year Index

Stock Benchmark

If your asset allocation target is 50% stocks and 50% bonds, your benchmark will be made up of:

30% S&P 500
6% Russell Mid Cap
5% Russell 2000
9% MSCI EAFE
35% Barclays Aggregate Bond
15% Barclays U.S. Government/Credit

What this means for your portfolio

There will typically be a small difference between the benchmark and our performance since we report our performance net of fees. The indexes do not have fees since investments cannot be made directly in an index.
If you wish to discuss the new benchmark, your portfolio allocation, or any other concerns, please call us. As always, we appreciate your trust and confidence.

Warmest regards,
Platt Wealth Management
Login

[ultimatemember form_id=”1899″]

×